How I set inventory policy across sites
Three plants, one shared long-lead component, and every item sorted into the policy it earns from its own demand signature. Every number computes live in your browser.
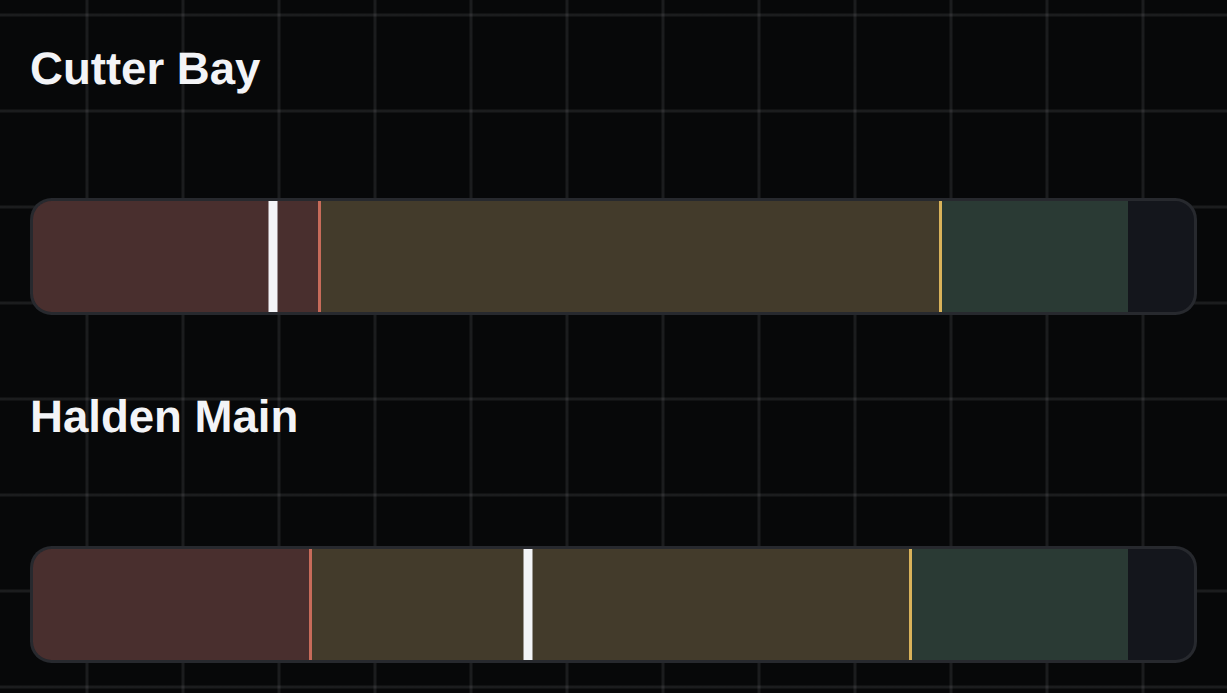
This is how I reason about inventory policy across sites - demand signatures, DDMRP buffers, and pooling - the way a global multi-site manufacturer running ten-plus ERP systems actually has to. Halden Forgeworks is a fictional company; the method is real.
Problem
When each plant plans its own island, two of them buy the same long-lead part from the same supplier and neither can see the other's orders. The supplier reads two jumpy signals for one real demand, both sites carry a full cushion against the same risk, and someone still stocks out. The fix is a shared net-flow view and a policy per item that matches how that item actually sells.
I do not demonstrate on an employer's or a client's data. So I invented a manufacturer and rebuilt the method from scratch on numbers I made up.
What it does
Every item carries a demand signature: how often it sells, and how much a sale swings when it does. That signature sorts it into one of five policy bands, from standing auto-ship to flagged for human review. Buffers reorder off net flow rather than a fixed point. A toggle plans the shared component two ways, as blind islands or as one pooled network buffer, and shows what the difference costs.
The classification, the policy, the buffer zones, and the net-flow status all compute from the raw scenario inputs. Nothing is hand-tuned to look good.
Outcomes - every claim graded
Every claim here is either verified against an artifact I can show you, or marked as my own report. Ask for either.
- Every figure computes live in the browser from scenario inputs; change an input and the whole board recalculates
- How graded
- checked mechanically on the stated date
- Source
- the live demo at /demos/planning/ recomputes every figure from its scenario inputs; checked in a headless browser under the production CSP, 2026-07-20
- Every named statistical method cites its primary source
- How graded
- checked mechanically on the stated date
- Source
- the cited primary sources open live; verified 2026-07-20
- The pooling magnitude is a scenario input encoding partial correlation. The direction is a published result; the size is mine to defend
- How graded
- from the project's own records, not independently re-checked
- Source
- Eppen (1979) establishes the square-root pooling result; the magnitude here is my scenario input, labeled as such on the demo page
Governance
- Synthetic data only: a fictional manufacturer, invented item numbers and quantities, no real company or client referenced
- The pooling direction is a published result; the magnitude is a labeled scenario input, the number I would want challenged first
- Every named statistical method cites a primary source that opens live
- The classification, the policy, the buffer zones, and the net-flow status all compute from the raw inputs, so nothing is hand-tuned
What transfers
Method selected from the literature rather than habit, cited so it can be checked, computed rather than asserted, and my own softest assumption labeled as such. That is what I would bring to a planning review, and it is the reason I can build this without touching anyone's data.